-=The Script=- Creators Edition-=The Script=- Creators Edition
A classic edition in the series of -=The Script=-
The pre-weighted values compatible with many coinpairs:
• A combination of standard indicators that produce very nice results when touched by -=The Script=- Creator!
DISCLAIMER:
The creators of these script are not financial advisors, and as such, this script is not financial advice. Anything seen or used within this script is here simply for educational purposes and it is up to you to decide what to do with this information and results. Please do your own research and verify any outcome made before deciding to act upon them. Do not commit any of your own resources to any trading or cryptocurrency activities without first verifying the accuracy of the information and know that your decisions are your own.
Cari dalam skrip untuk "the script"

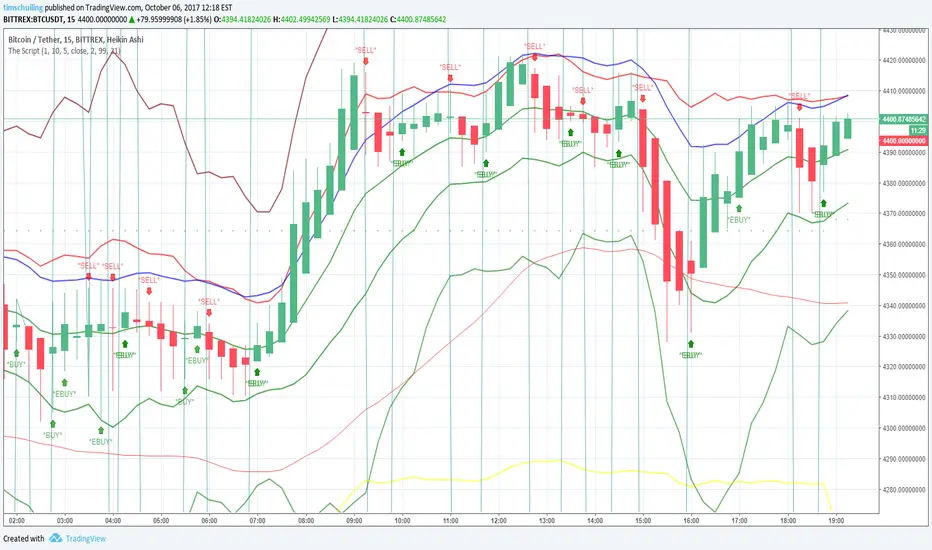
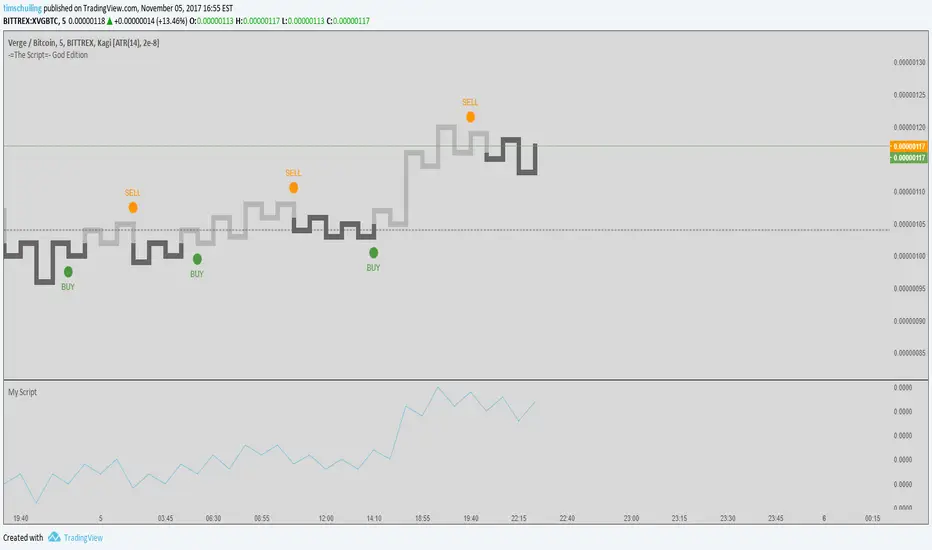
-=The Script=- What ElseThe Script What Else?
A brand new approach to an old question. What's it gonna be?! Yes or No? Up or Down?
Should i Buy or should i Sell?
The Script knows.

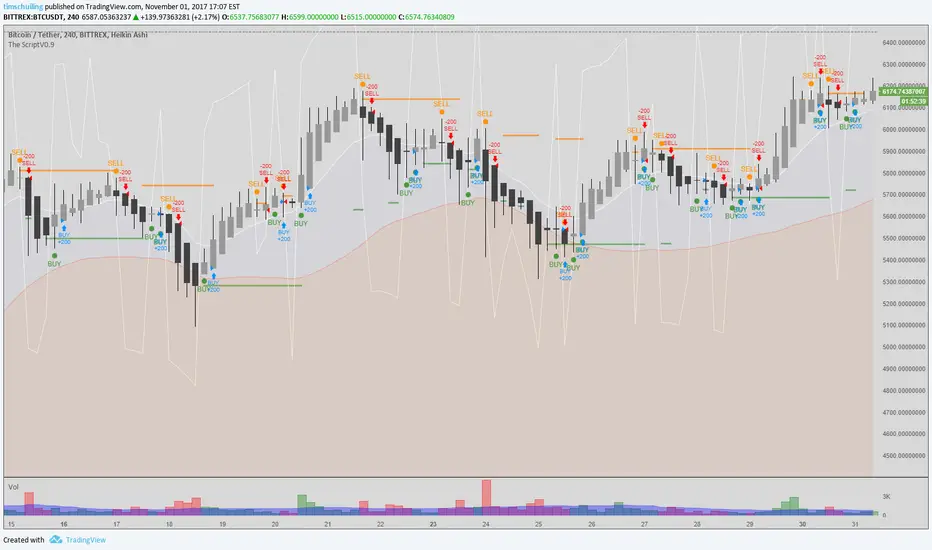
The Script @ BTCUSDTThe script is a universal algorithm wich can be applied to all coin pairs
Soon highly optimized versions of The Script will be available for all the major USD(T) pairs.
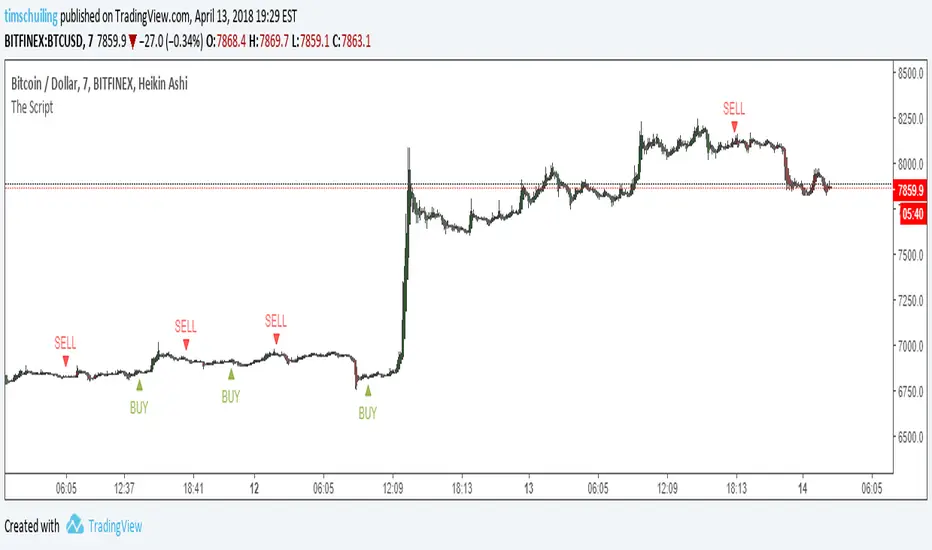
The ScriptThe Script
A brand new approach to an old question. What's it gonna be?! Yes or No? Up or Down?
The Script knows.
Take a look and see it with your own eyes.

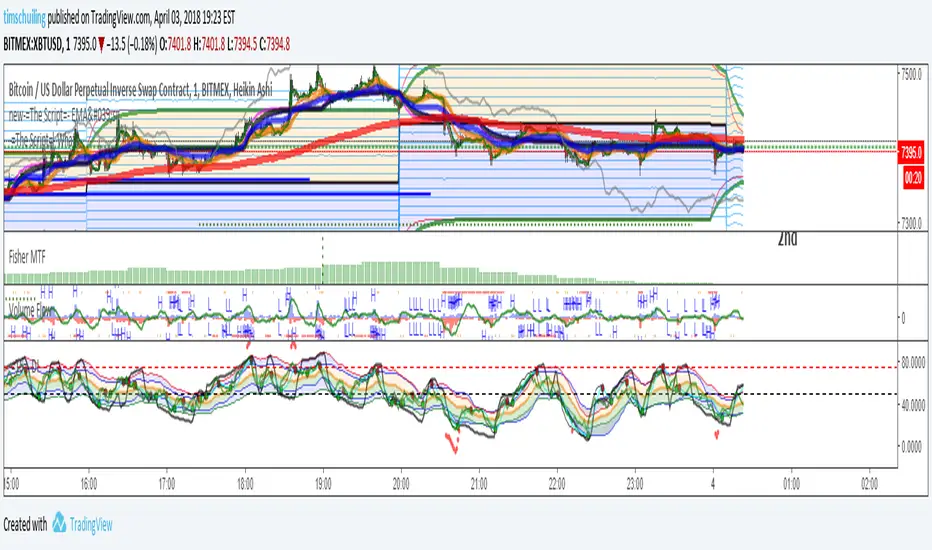
-=The Script=- DI-=The Script=- DI, Fisher Transformation
A indicator build around fisher transformation, aka wavetrend.

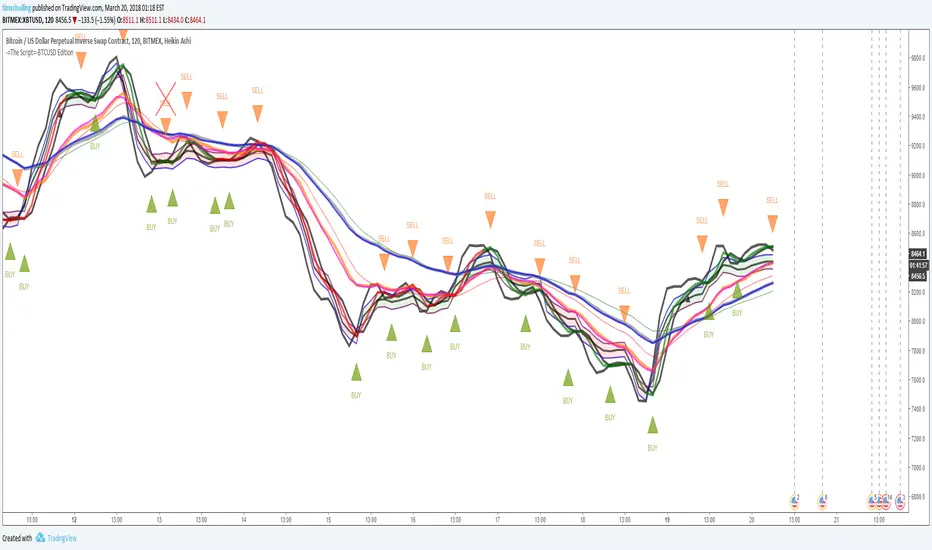
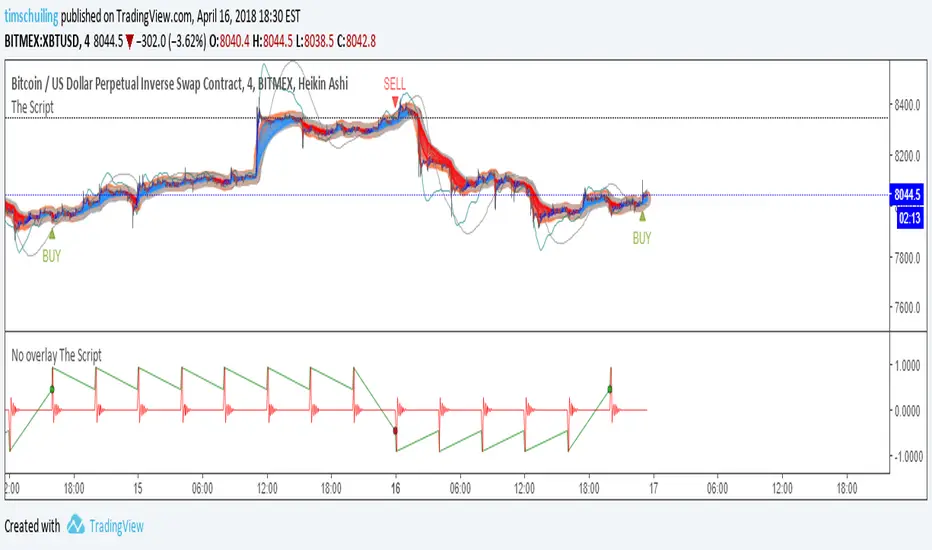
-=The Script=-BTCUSD Edition-=The Script=- optimized for BTCUSD
Fire it at will against any exchange.
2 Hr chart for best results.
It can do smaller time frames like 5 minute. But that is up to you.
The ScriptThis latest editon in the series of -=The Script=-
The pre-weighted values are optimized for crypto and this one uses a custom indicator:
• Heartbeat Indicator
The settings for this strategie use:
• Chart Period
• Strategy Period
• Signal Lenght
• Aggressiveness
DISCLAIMER:
The creators of these script are not financial advisors, and as such, this script is not financial advice. Anything seen or used within this script is here simply for educational purposes and it is up to you to decide what to do with this information and results. Please do your own research and verify any outcome made before deciding to act upon them. Do not commit any of your own resources to any trading or cryptocurrency activities without first verifying the accuracy of the information and know that your decisions are your own.
-=The Script=- On Fire - Leverage Edition=The Scrip=- On Fire - Leverage Edition
This latest editon in the series of -=The Script=-
The pre-weighted values are optimized for USD(t)-Pairs and this one uses 1 indicator:
• Custom Indicator
The settings for this strategie use:
• Strategy Period and Chart Period😊
DISCLAIMER:
The creators of these script are not financial advisors, and as such, this script is not financial advice. Anything seen or used within this script is here simply for educational purposes and it is up to you to decide what to do with this information and results. Please do your own research and verify any outcome made before deciding to act upon them. Do not commit any of your own resources to any trading or cryptocurrency activities without first verifying the accuracy of the information and know that your decisions are your own.


Start the Script on Last Nth Bar [Experimental]Hello Pine Scripters,
Sometimes we need to run some processes in the scripts on last N bar but currently we don't know bar_index value of realtime bar or number of remaining bars before we reached it. So most of us use "start date" as input and run some processes after "start date".
This experimental script finds last Nth bar approximately. As you can see in the script we (should) use GMT, otherwise as I see the result might not be accurate (we don't know timezone used on the chart)
The idea is to find/use similar bar in the past (using timenow as reference) and then calculate aproximate the time of last Nth bar. the results may not be accurate all the time, also we can not know local holidays etc.
At the moment the script works on 1minute or higher time frames (it won't work on less 1min timeframes)
In the future if the Pine Team add something like "bar_index_realtime" then we will not need such things. by the way many thanks to Pine Team, they are doing great job.
You can use this script in your scripts as you want, no need to ask permission. If you can improve it let me know ;)
Enjoy!

[Indicator]The Script additional chartAdd on chart for the latest edition of -=The Script=-
• Heartbeat Indicator
DISCLAIMER:
The creators of these script are not financial advisors, and as such, this script is not financial advice. Anything seen or used within this script is here simply for educational purposes and it is up to you to decide what to do with this information and results. Please do your own research and verify any outcome made before deciding to act upon them. Do not commit any of your own resources to any trading or cryptocurrency activities without first verifying the accuracy of the information and know that your decisions are your own.

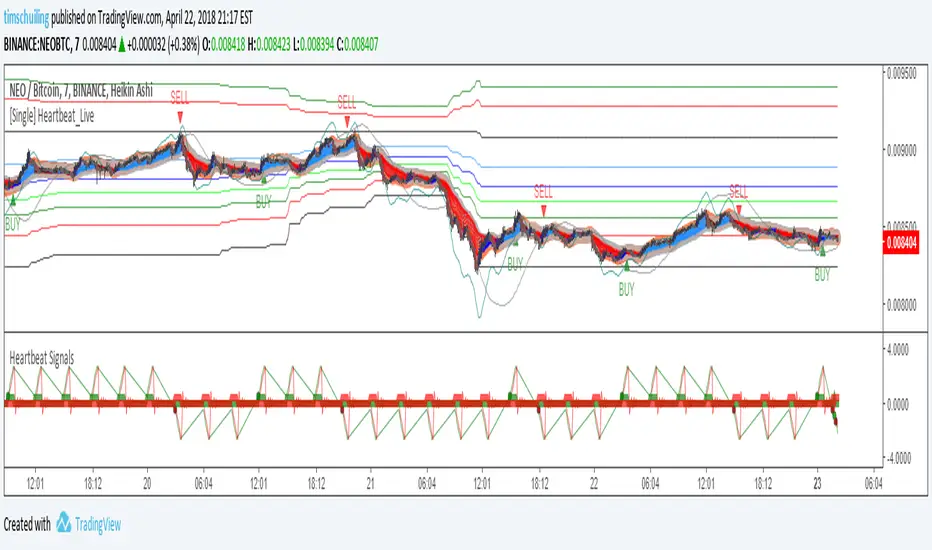
[Single] Heartbeat_Live-=The Script=- Tradingviews #1 Custom Alert Script -non repaint-
The Script has been developed for over a year now, always striving to build the most efficient and highest ROI script on the market. This script has been designed for trading Bitcoin, but has now been expanded to being very efficient on most market types, including forex and altcoins. The ability to have alerts on our script gives you the rare ability to automate this script using autoview or Gunbot tradingview extension.
-Alerts
-non-repaint
-limit edition
-Lifetime updates
Altcoin Screenshot:
Bitcoin Screenshot:
Forex Screenshot:
This script is a custom built indicator exclusively used on this script. You are able to fine tune the script to all of your needs, allowing you to adjust period settings, sensitivity and more so you can always have the signals you want.
Not only do you get access to the heartbeat script, but you also get access to our library of other non repaint alert scripts, including Renko Alert scripts and Scripts designed Specifically for leverage.
For more information gunbot.store
*disclaimer*
With the purchase of The Script, you are not given access to source code and we do not give trials. We do however give a guarantee of good support and updates where needed to comply with the signals shown above.
It could start repainting depending on tradingview's engine updates, as soon that will happen we are on top of it to fix it.
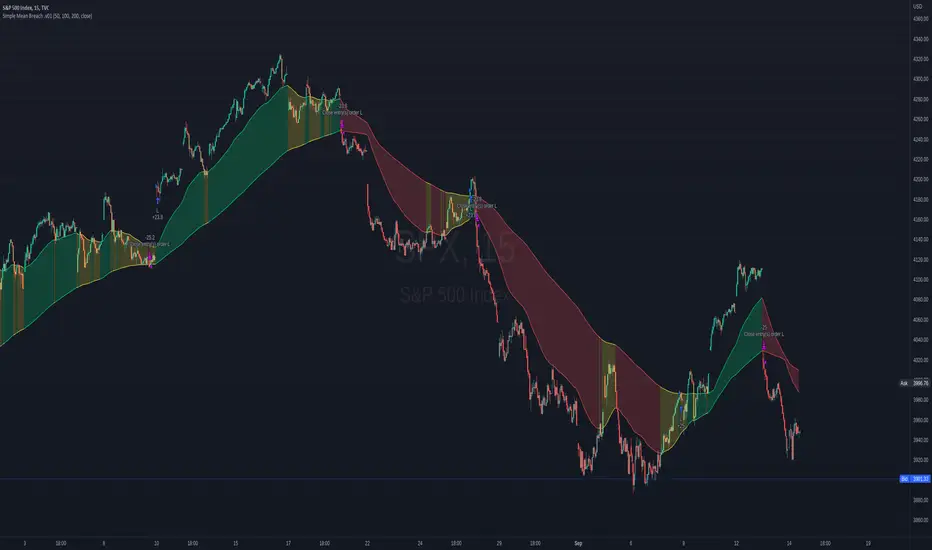
Simple Mean Breach .v01The script is based on moving averages, therefore the underbelly is no different from existing indicators. I've also borrowed ideas from existing scripts. However, this script is meant to help you automate your trading. I removed all the noise of multiple SMA lines, so it's easy to focus on what's important for entering or exiting the position; the top and bottom line at any point in time or price level.
Recommended use and markets:
You buy or sell when the price breaches the band. I would recommend focusing on one direction when using this indicator; I prefer going long. This works well with major indices (SPX, NDX, DJI) at 15m or 30m or even 10m, but not the crypto or individual stocks.
Notice that even when the S&P500 is in decline, you can still profit from the occasional powerful rally...if you stick to the script. This script is a visualisation that could help you take emotions out of your trading....you're welcome :)
Ichimoku Kinkō hyō Keizen 改MTF善The script is not finnished yet and show's an other interpretation of how it could be scripted
Step -1 is complete... Basic Ichimoku with asjutable length and editable lines colors and visibilities.
Step -2 in progress... Adding ability to une multiple Spans, sens and Kumo on higher and lower timeframe.
Your Step : Like and Share ;) have a good year 2020 !
2020-01-06 /--------/ -R.V.
Jan 06
Release Notes: The script is not finnished yet and show's an other interpretation of how it could be scripted
Step -1 is complete... Basic Ichimoku with asjutable length and editable lines colors and visibilities.
Step -2 in progress... Adding ability to une multiple Spans, sens and Kumo on higher and lower timeframe.
Your Step : Like and Share ;) have a good year 2020 !
2020-01-06 /--------/ -R.V.
Jan 07
Jan 13
Release Notes: MTF Ichimoku is on it's way !!
Jan 17
Release Notes: The script is not finnished yet and show's an interpretation of how it could be scripted
Step -1 is complete... Basic Ichimoku with asjutable length and editable lines colors and visibilities.
Step -2 in complete... Adding ability to use multiple Spans, sens and Kumo on higher timeframe.
Step -3 in progress... Creating a UNIX based function to framgments actual chart periods in subcandles or "Subprices/periods" to plot multiple Spans, sens and Kumo on LOWER timeframe.
Your Step : Like and Share ;) have a good year 2020 !
/--------Coder--------/ -R.V.

ramzes with strategyThe script is a strategy version of standart ramzes script.
That scripts has next way to use:
1.Determine trend direction, by cheking direction of EMA233 (optionally). If it grows - bullish , if falling - bearish trend .
2.Then use BUY signal to long and SHORT signal to sell. Everything is simple
Ribbed Bars showes stoploss level

ATR Trend Run - Signals Alerts SL and TP by Tech Store OnThe script uses several ATR formulas for entering/exiting trades, support/resistance lines to take TP1 (take profit 1) and another ATR formula for TP2 (take profit 2). Everything is fully configurable to your preference, and you can back-test it via TradingView. You can also configure the indicator for signals during US trading sessions (with or without power hour), as well as taking profits/stop-loss session time(s), as well as to close a position at the end of the trading session no matter what. Also, you can turn all of that off, so there are no trading session/end of day limits and each trade will run until it either hits SL, TP1, TP1 > back to entry, TP2. Note: indicator is set to skip consecutive/opposite signals, while you currently have a trade open > if you hit a trend – ride it to the end!
For example: If you will be day trading SPY and you wish to close your positions no matter what right before the market closes (3:45PM ET > 15min before closes): Make sure to checkbox “Intraday – Close Position Before Market Closes” in the strategy/indicator Settings, so that you are alerted soon before the market closes, if you wish to continue holding the position – leave this checkbox unchecked.
SL: SL is set to be slightly above/below the signal candle, which is best suited for this strategy.
Strategy Take Profit Approach
While the initial position open and SL hit is always based on a closed candle bar (can’t do otherwise, as otherwise you will have 10s of fake signal alerts), there are 2 ways on trading this strategy in terms of TP1 and TP1 taken > back to Entry, which is based off Alert type.
You can switch this as you like within the indicator settings, “Checked: TP1 taken > back to Entry per Price Touch | Unchecked: per Candle Close”.
Candle Close vs Price Touch: with the Default method - Candle Close for an alert for TP1 or if price comes back to Entry after TP1 is taken will only be triggered once candle bar fully closes crossing the area, while Price Touch will alert when price touches the area before candle bar closes.
For example: your trade is running well, you grab TP1 and the price reverses and hits your trade Entry area. With Price Touch – you are immediately alerted to close your trade with no loss and with TP1 profit. With Candle Close - you will receive an alert only once candle bar fully closes on top of the Entry crossing it backwards, meaning it may lower your TP1 profit or even completely reverse the trade into loss in case it will be a huge candle bar for any reason. However, it may touch the Entry area, looking like the price is reversing, but then continue per initial trade direction, sometimes becoming a trend. So, while Price Touch seem like a more conservative approach, Candle Close can give you much bigger profits if you catch a trend, but you can always change it via the Settings.
Note: TradingView back-testing engine does not have a feature to open/close orders IMMEDIATELY via Price Touch trigger, but only when the candle closes after price touches the scripted area/line/etc., so you for the most accurate results, test your strategy out via Candle Close setting. Otherwise, decide yourself. I personally like more Candle Close since I can test it out via back-testing with the most accurate results.
TP2 is set per Candle Close as often the ATR trailing stop line will be hit and bounced off, so it’s best to wait until candle actually breaks it/closes through it.
Note: If you will be observing the strategy LIVE, during LIVE candle bar movement – it will look weird, like it’s placing an order after order during any trigger – this seem like a TradingView bug, but is only observational, once the candle bar is closed and you refresh TradingView it will all look correct.
Back-Testing
If you wish to do some back-testing, just modify the strategy/indicator Settings:
-----1) STRATEGY: This is for back-testing/experimenting with the script inputs.
----------a. You can setup a start date (date, month, year) from which it will start opening back-test trades, select a position size and select TP1 size, the idea here is to close half (or whatever you choose) portion of the trade once you hit your TP1, then to either close at small profit or to catch a trend and close the second portion of the position long way ahead from Entry, otherwise it will alert you to close the position at TP2, if price comes back to Entry, at reversal signal or at the end of US trading session if the option for it is checked. If you wish to close the whole position at TP1, just enter the same amount for TP1 to match backtest position size. Otherwise you can experiment with TP1 sizing – try it out!
-----2) Feel free to experiment with ATR settings and with S&R Left/Right bars, you may be amazed how results will differ and find some really cool combinations!
-----3) Make sure you select/de-select “Intraday – Close Position Before Market Closes” setting depending on what you are back-testing and on which conditions
-----4) Note: If you wish to do some deep back-testing (1+ years), use the “Deep Backtesting” feature within Strategy Tester on the TradingView as otherwise it may show wrong results or even fail to compute the results
Add the alerts
-----Right-click anywhere on the TradingView chart
-----Click on Add alert
-----Condition: ATR Trend Run - Signals Alerts SL and TP, by Tech Store On
----------o Right underneath the condition click on the drop-down menu and select “alert() function calls only”
-----Expiration time: Whatever you wish
-----Alert actions: Whatever notifications you wish
-----Alert name: DO NOT TOUCH THIS
-----Hit “Create”
-----Note: If you change ANY Settings within the indicator – you must DELETE the current alert and create a new one per steps above, otherwise it will continue triggering alerts per old Settings!
- Note: If you add the alert while the script is currently “In Position” it will not know that. So either wait when there will be no position open at all or close your position partially if the bot opens it twice bigger or so in case per script the bot will think it is already in position.
Note: Because of the slippage and the order processing time between TradingView, AutoView and the Broker (it’s usually about a second or so), it is suggested to not use a timeframe lower than 1min. The script is working really well with 1M/3M/5M/H1/H4 timeframes per my back-testing, but feel free to explore via Strategy Back-testing what’s best for the instrument you wish to trade.
If you wish to try this out for a week or so – please reach out and I will give you access.

Week designationThe script is primarily used for visualizing the beginning and end of the week. It is particularly helpful when working with time intervals shorter than one day. In a very simple and clear manner, you can see when a specific week has started. This makes it easier to assess the market sentiment in a short timeframe.
Here are the operating principles of this script:
Initialization:
The script begins with initialization, where basic parameters and settings such as line colors and line style are defined.
Determining the Session Start:
The startSession(hour, minute) function is used to calculate the starting time of a session on the chart. Sessions can be divided into different time intervals, such as the daily session (D), weekly session (W), and monthly session (M).
Checking for Session Start:
The script checks if a new session is starting. If so, a vertical line is inserted on the chart to mark the beginning of that session.
isSessionStart checks for the start of the daily session.
isSessionStart_2 checks for the start of the weekly session.
isSessionStart_3 checks for the start of the monthly session.
Marking Mondays:
The script checks if the current day is Monday (the day of the week number 2 represents Monday).
If the current session is starting or it is Monday, a vertical line is inserted on the chart with the day designation (color color_day).
Marking Lines on the Chart:
The lines inserted on the chart are vertical and have a specified style and color, which can be customized in the settings.

FRAMA & CPMA Strategy [CSM]The script is an advanced technical analysis tool specifically designed for trading in financial markets, with a particular focus on the BankNifty market. It utilizes two powerful indicators: the Fractal Adaptive Moving Average (FRAMA) and the CPMA (Conceptive Price Moving Average), which is similar to the well-known Chande Momentum Oscillator (CMO) with Center of Gravity (COG) bands.
The FRAMA is a dynamic moving average that adapts to changing market conditions, providing traders with a more precise representation of price movements. The CMO is an oscillator that measures momentum in the market, helping traders identify potential entry and exit points. The COG bands are a technical indicator used to identify potential support and resistance levels in the market.
Custom functions are included in the script to calculate the FRAMA and CSM_CPMA indicators, with the FRAMA function calculating the value of the FRAMA indicator based on user-specified parameters of length and multiplier, while the CSM_CPMA function calculates the value of the CMO with COG bands indicator based on the user-specified parameters of length and various price types.
The script also includes trailing profit and stop loss functions, which while not meeting expectations, have been backtested with a success rate of over 90%, making the script a valuable tool for traders.
Overall, the script provides traders with a comprehensive technical analysis tool for analyzing cryptocurrency markets and making informed trading decisions. Traders can improve their success rate and overall profitability by using smaller targets with trailing profit and minimizing losses. Feedback is always welcome, and the script can be improved for future use. Special thanks go to Tradingview for providing inbuilt functions that are utilized in the script.

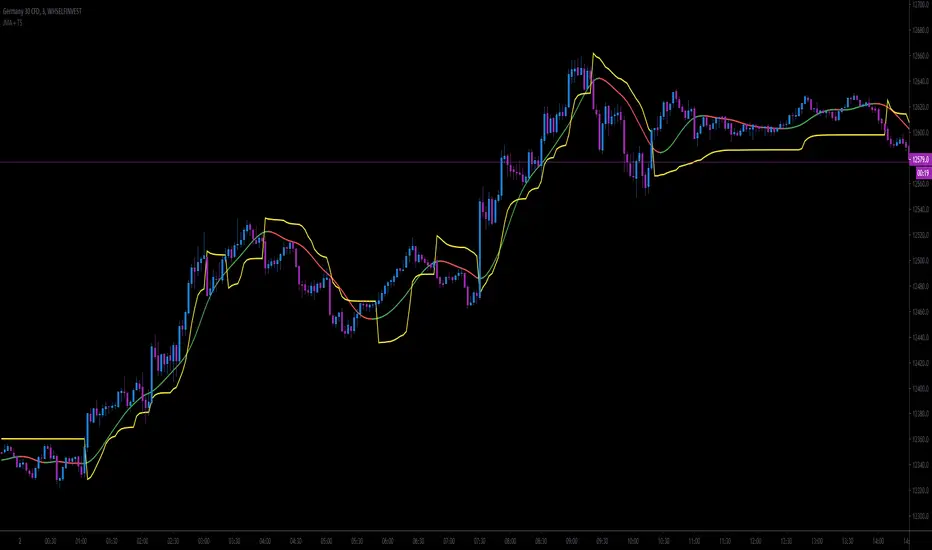
JMA + A2RTS + AlertsThe script is a combination of two high quality scripts Everget's JMA and Alex Grover's A2RTS script, all credit too them for the original code.
Additional thanks to Mango2Juice for the continued help as this is my first script published and it would not of been possible without the help.
The goal of this script is to allow for you to enter into trends and too keep you in them while maximizing profit.
Trade Conditions:
Buy Enter: when JMA goes from red to green and use yellow line (A2RTS) as a trail stop
Buy Exit: when A2RTS flips or JMA goes back to red
Sell Enter: when JMA goes from green to red and use yellow line (A2RTS) as a trail stop
Sell Exit: When A2RTS flips or JMA goes back to green
Alerts have also been added for when JMA changes color and when A2RTS flips
Please drop a comment below if this script is helpful or if you have any question
Once again this is my first script and I hope you all enjoy it.